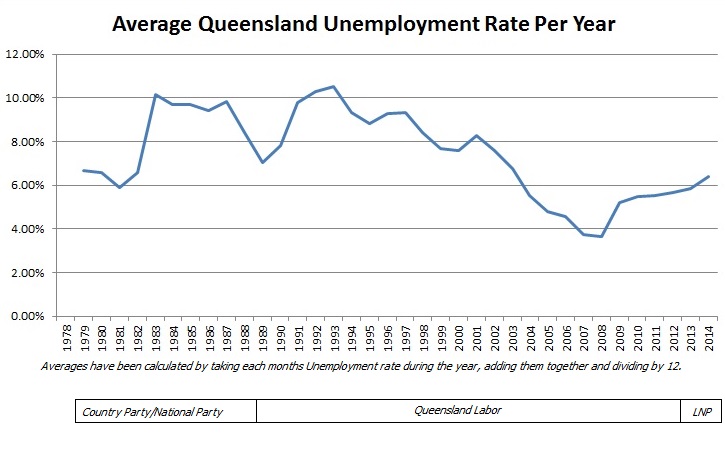
Queensland Elections and Unemployment Rates
Labor held power in Queensland from 2nd December 1989 to 24th March 2012 (22.3 years)
LNP held power in Queensland from from 24th March 2012 to at least 31st January 2015 (2.8 years)
State Unemployment rates at the Election dates have included the following:
Male Unemployment Rate at the 2006 Election, after 14 years of Labor was 4.5%
Male Unemployment Rate at the 2009 Election, after 17 years of Labor was 5.0%
Male Unemployment Rate at the 2012 Election, after 23 years of Labor was 5.2%
Male Unemployment Rate nearest the 2015 Election, after 3 years of LNP was 6.9% (Nov 2014)
Why has Queensland Unemployment risen consistently since 2006 ?
If we compare to New South Wales for the same months we see a similar trend indicating it may be a National issue rather than a local State based issue:
NSW Male Unemployment rates at the same time
4.6% 2006
5.7% 2009
5.0% 2012
6.3% Nov 2014
Why is the Australian Unemployment Rate rising?
Is this still the result of the Global Financial Crisis ?
Is is partly due to the change in the value of the Australian currency going back to its pre GFC days ?
Do individual State Governments have that much effect on these rates ?
Is it actually rising ?
Australian Unemployment 1989 to 2014
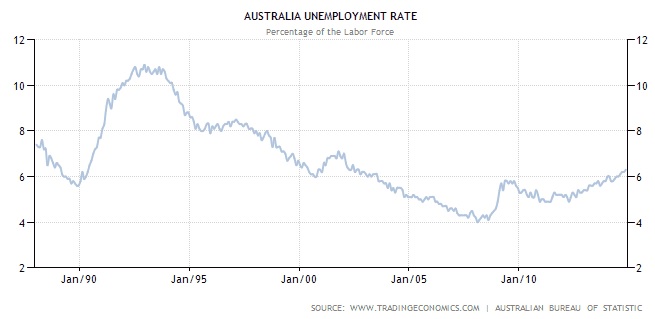
It is, but when we look long term, it seems lower than it has been for some years.